Stock Exchanges Ranked by Market Capitalisation
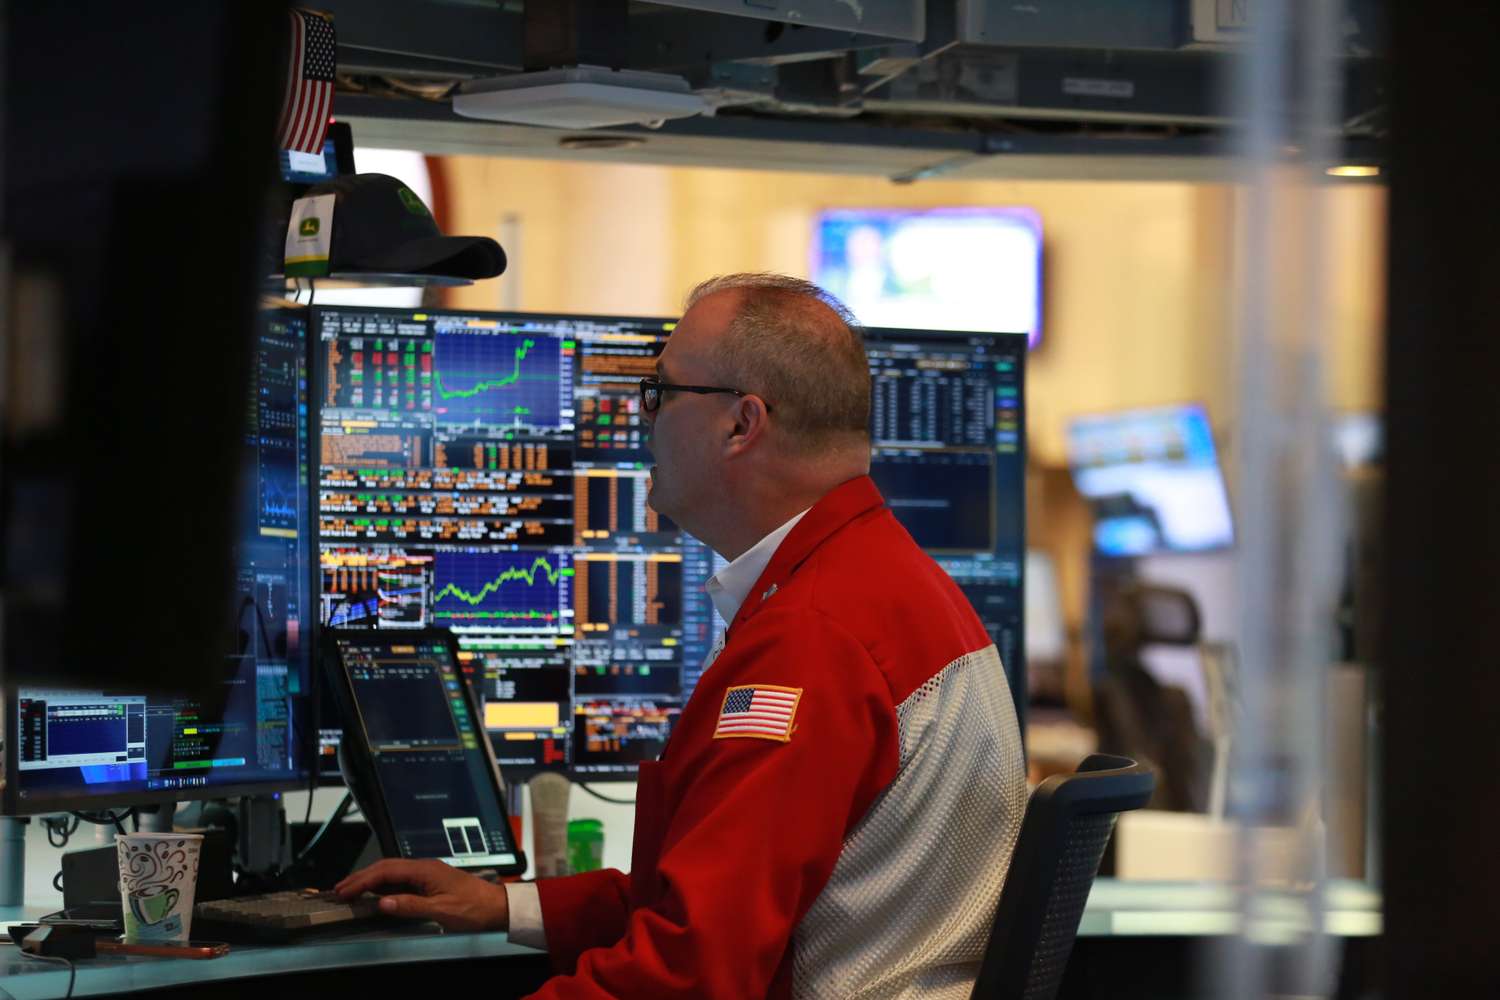
Something genuinely unusual happened in 2026: Nasdaq passed the New York Stock Exchange to become the largest exchange in the world by market capitalisation, a position the NYSE had held for as long as the measure has existed. The reason is not that more companies listed there, it is that the companies already listed there are the ones that grew, which tells you most of what you need to know about where value has concentrated over the past decade.
How this is ordered. Ordered by domestic market capitalisation as reported to the World Federation of Exchanges, largest first. Each row states its own as-of date, because members report on different schedules.
- 1
Nasdaq
United States. Technology-weighted.
$35.0TDomestic market capFirst place for the first time, having spent its entire history behind the NYSE. The composition explains it: Nasdaq is where the largest technology companies list, and technology is what compounded fastest over the past decade. The same concentration that produced this ranking is the concentration that makes a US index fund far less diversified than its five-hundred-company label suggests.
March 2026, WFE domestic market capitalisation - 2
New York Stock Exchange
United States. Founded 1792.
$31.0TDomestic market capDisplaced from a position it had effectively always occupied, and still enormous. The NYSE skews toward established industrials, financials, healthcare and energy, which is why its listings held up better than Nasdaq's in 2022 and grew more slowly in the years either side. The two exchanges together are roughly two fifths of all listed equity value on earth.
March 2026, WFE domestic market capitalisation - 3
Shanghai Stock Exchange
China. Largely domestic investor base.
$10.2TDomestic market capThe largest exchange outside the United States, and structurally different from the two above it: access for foreign investors is restricted, and the listed base is weighted toward state-linked industry and banking rather than consumer technology. Its size relative to its accessibility is why most global index funds hold far less China than its economy would imply.
May 2026 - 4
Euronext
Pan-European, seven countries.
$8.7TDomestic market capNot a national exchange but a merged group operating markets in Amsterdam, Paris, Brussels, Dublin, Lisbon, Milan and Oslo on a single platform, which is why it outranks any individual European exchange. Consolidation of this kind is the main reason European listings hold together at all against US market depth.
March 2026, WFE domestic market capitalisation - 5
Japan Exchange Group
Japan. Tokyo and Osaka.
$7.6TDomestic market capJapan's listed market spent decades below its 1989 peak, and its recent strength owes as much to corporate governance reform pushing companies to release trapped balance-sheet value as to earnings growth. A useful reminder that a market can go sideways for a generation, which is the sort of horizon most return assumptions quietly ignore.
March 2026, WFE domestic market capitalisation - 6
Shenzhen Stock Exchange
China. Growth and technology weighted.
$7.35TDomestic market capChina's second exchange, and the one weighted toward private technology and manufacturing rather than state-linked incumbents, which makes it the closer analogue to Nasdaq than Shanghai is. The figure is converted from renminbi, so a meaningful part of any year-on-year change in the dollar number is the exchange rate rather than the market.
May 2026, converted from renminbi
Global equity market capitalisation across all WFE members reached roughly $151.9 trillion, up about 18.5% on the previous year end. The six exchanges below account for well over half of it.
Method and limits
Domestic market capitalisation counts companies headquartered in the exchange's own market and excludes foreign listings, which is the standard WFE measure and the reason these figures are lower than some other published numbers. Reporting dates differ by member, so the March and May 2026 figures here are not a single synchronised snapshot and small differences in rank between adjacent entries should not be read as meaningful. Figures for exchanges reporting in local currency are converted to dollars, so exchange-rate movement is inside the number.
Last reviewed August 11, 2026. General information only, and not investment advice. See our disclaimer.
These lists change, and we post when they do
Follow along on Instagram for the short version, or come into the Discord if you would rather ask a question and get an actual answer.